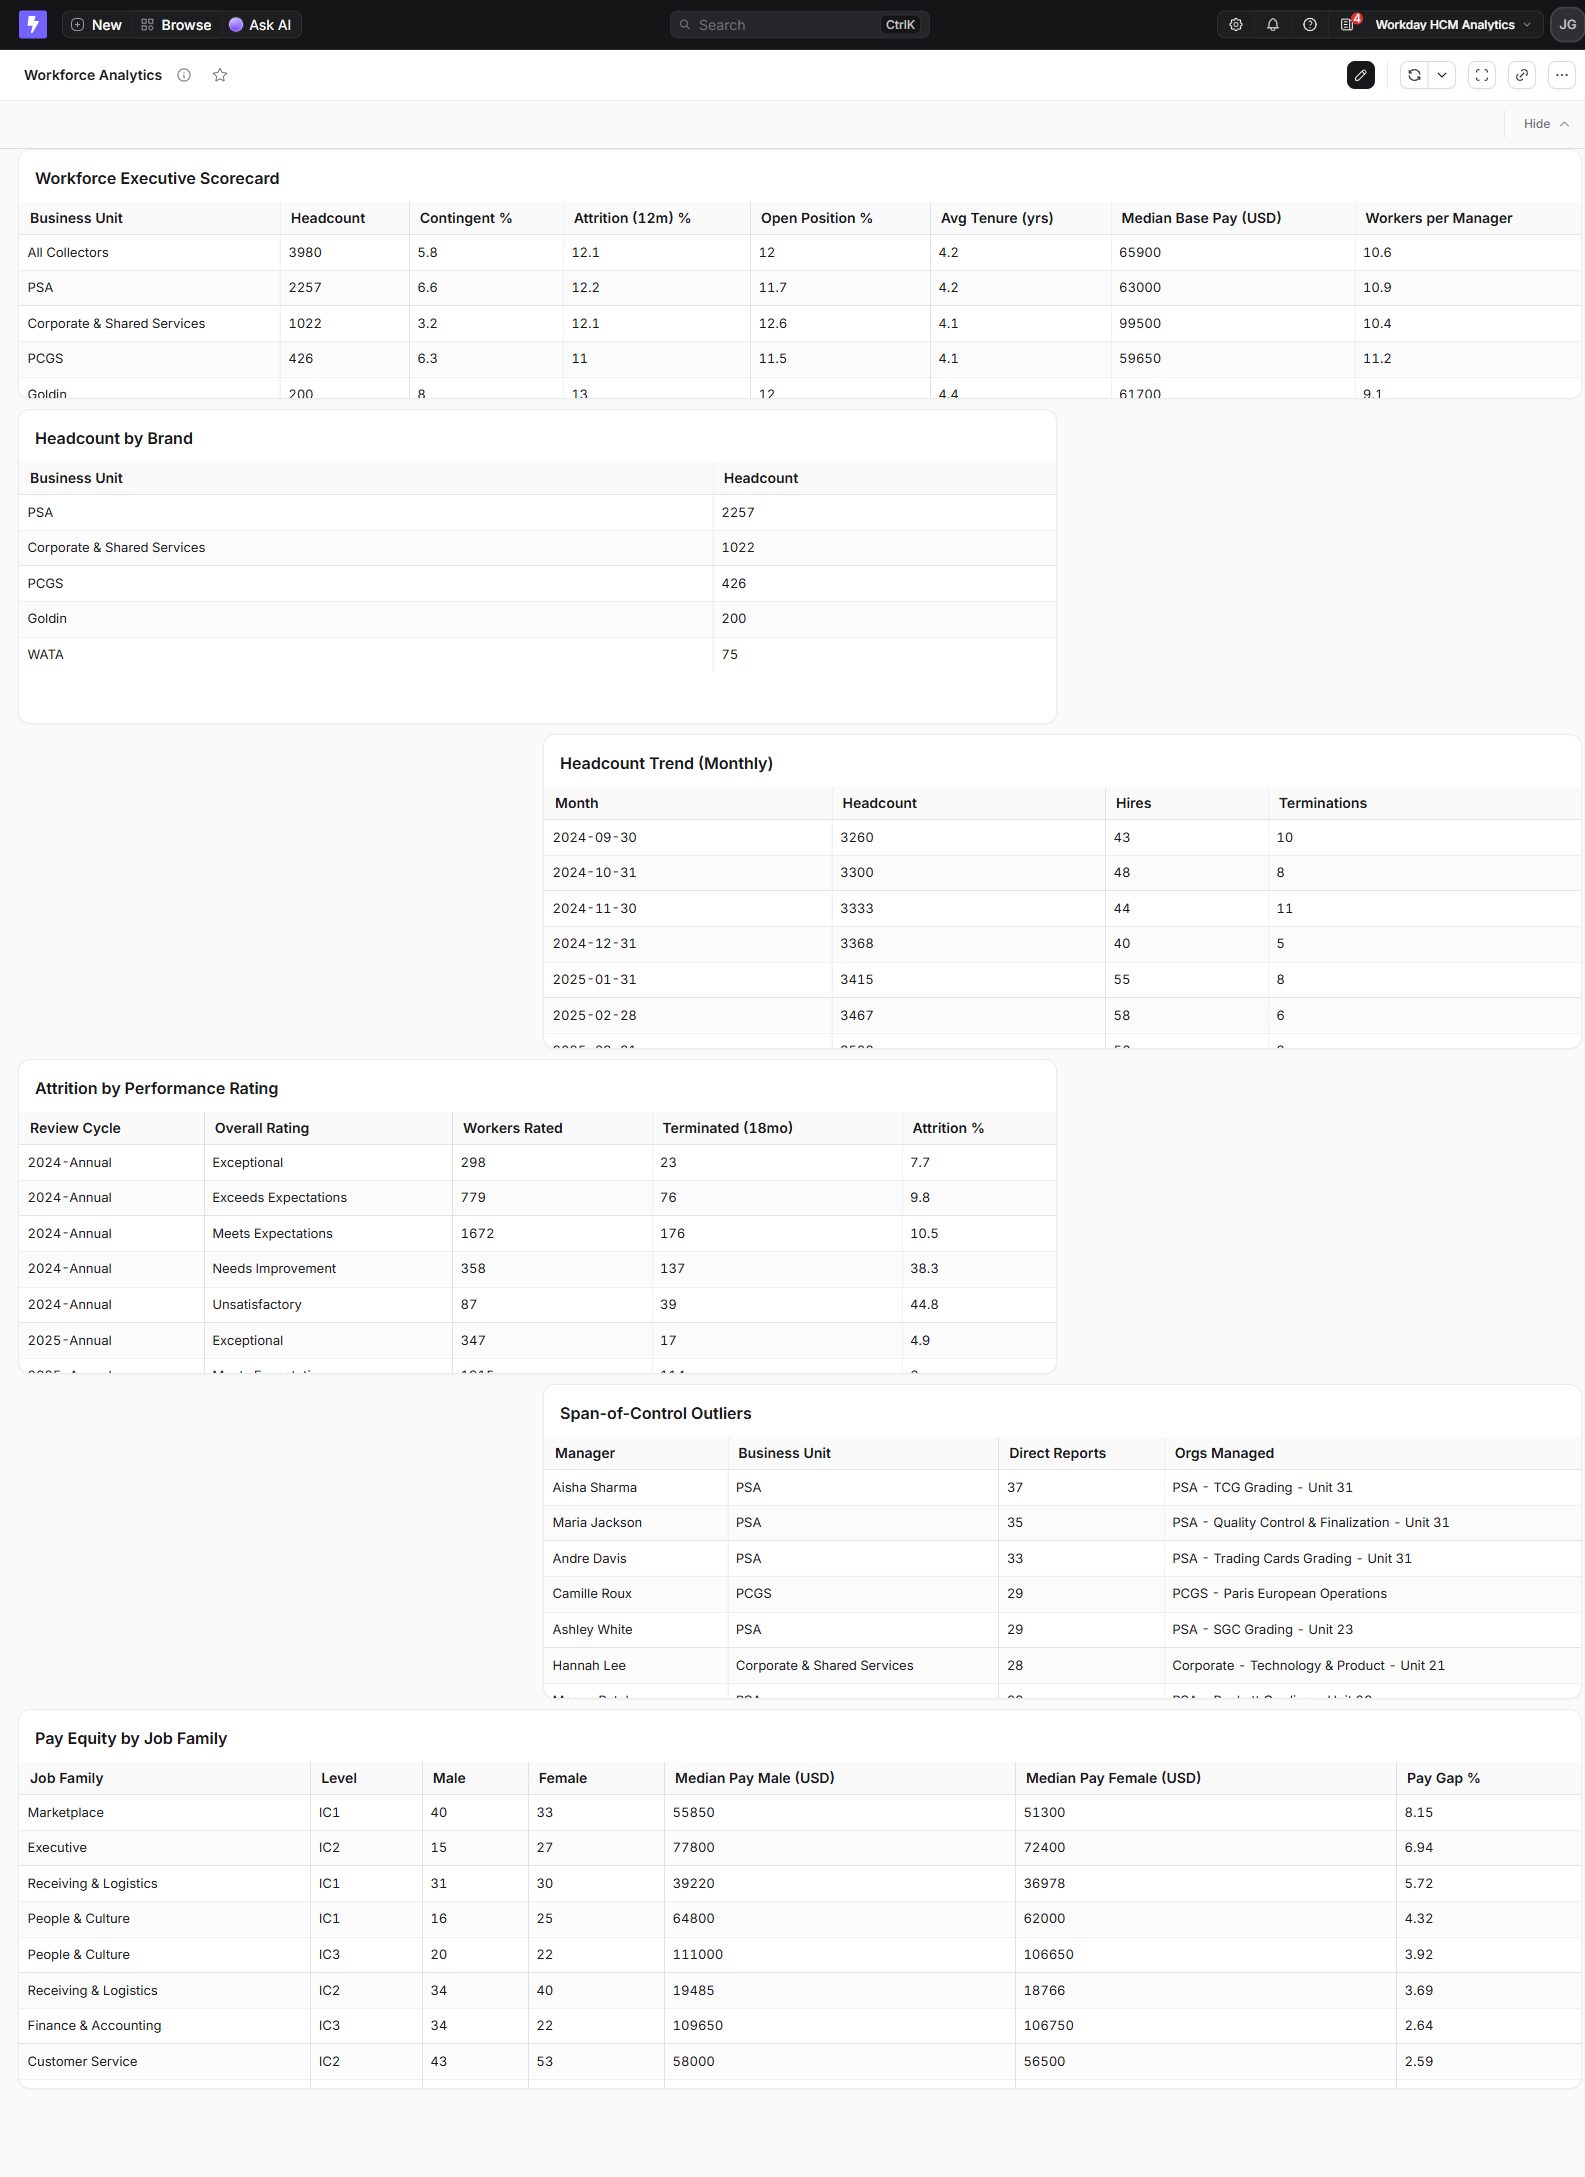
Workforce Analytics
Executive workforce, headcount, retention, capacity, pay, and manager coverage.
View live dashboardA business and technical guide to the synthetic Workday-style reporting stack: what each Lightdash chart answers, how its metrics are calculated, where its data comes from, and how the design is governed.
Browse representative views from the Workday HCM reporting portfolio. Select a dashboard to open its live Lightdash version.
Executive workforce, headcount, retention, capacity, pay, and manager coverage.
View live dashboard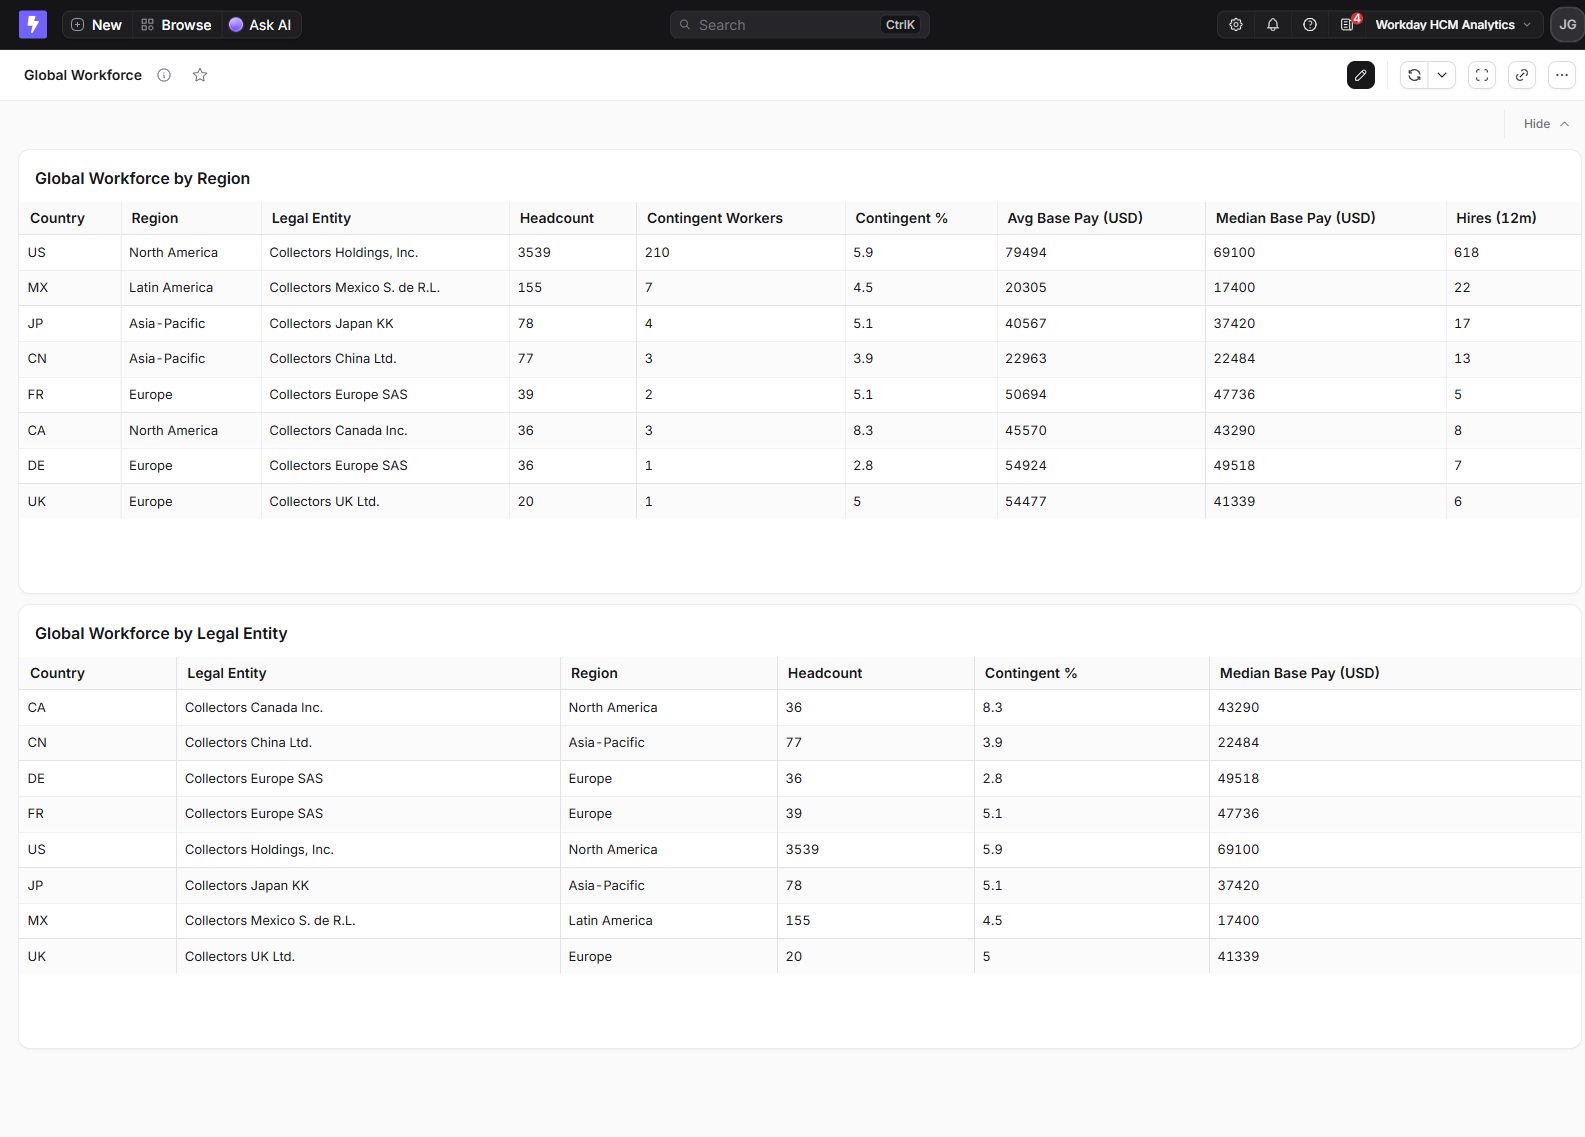
Regional workforce planning, legal entities, contingent mix, and pay.
View live dashboard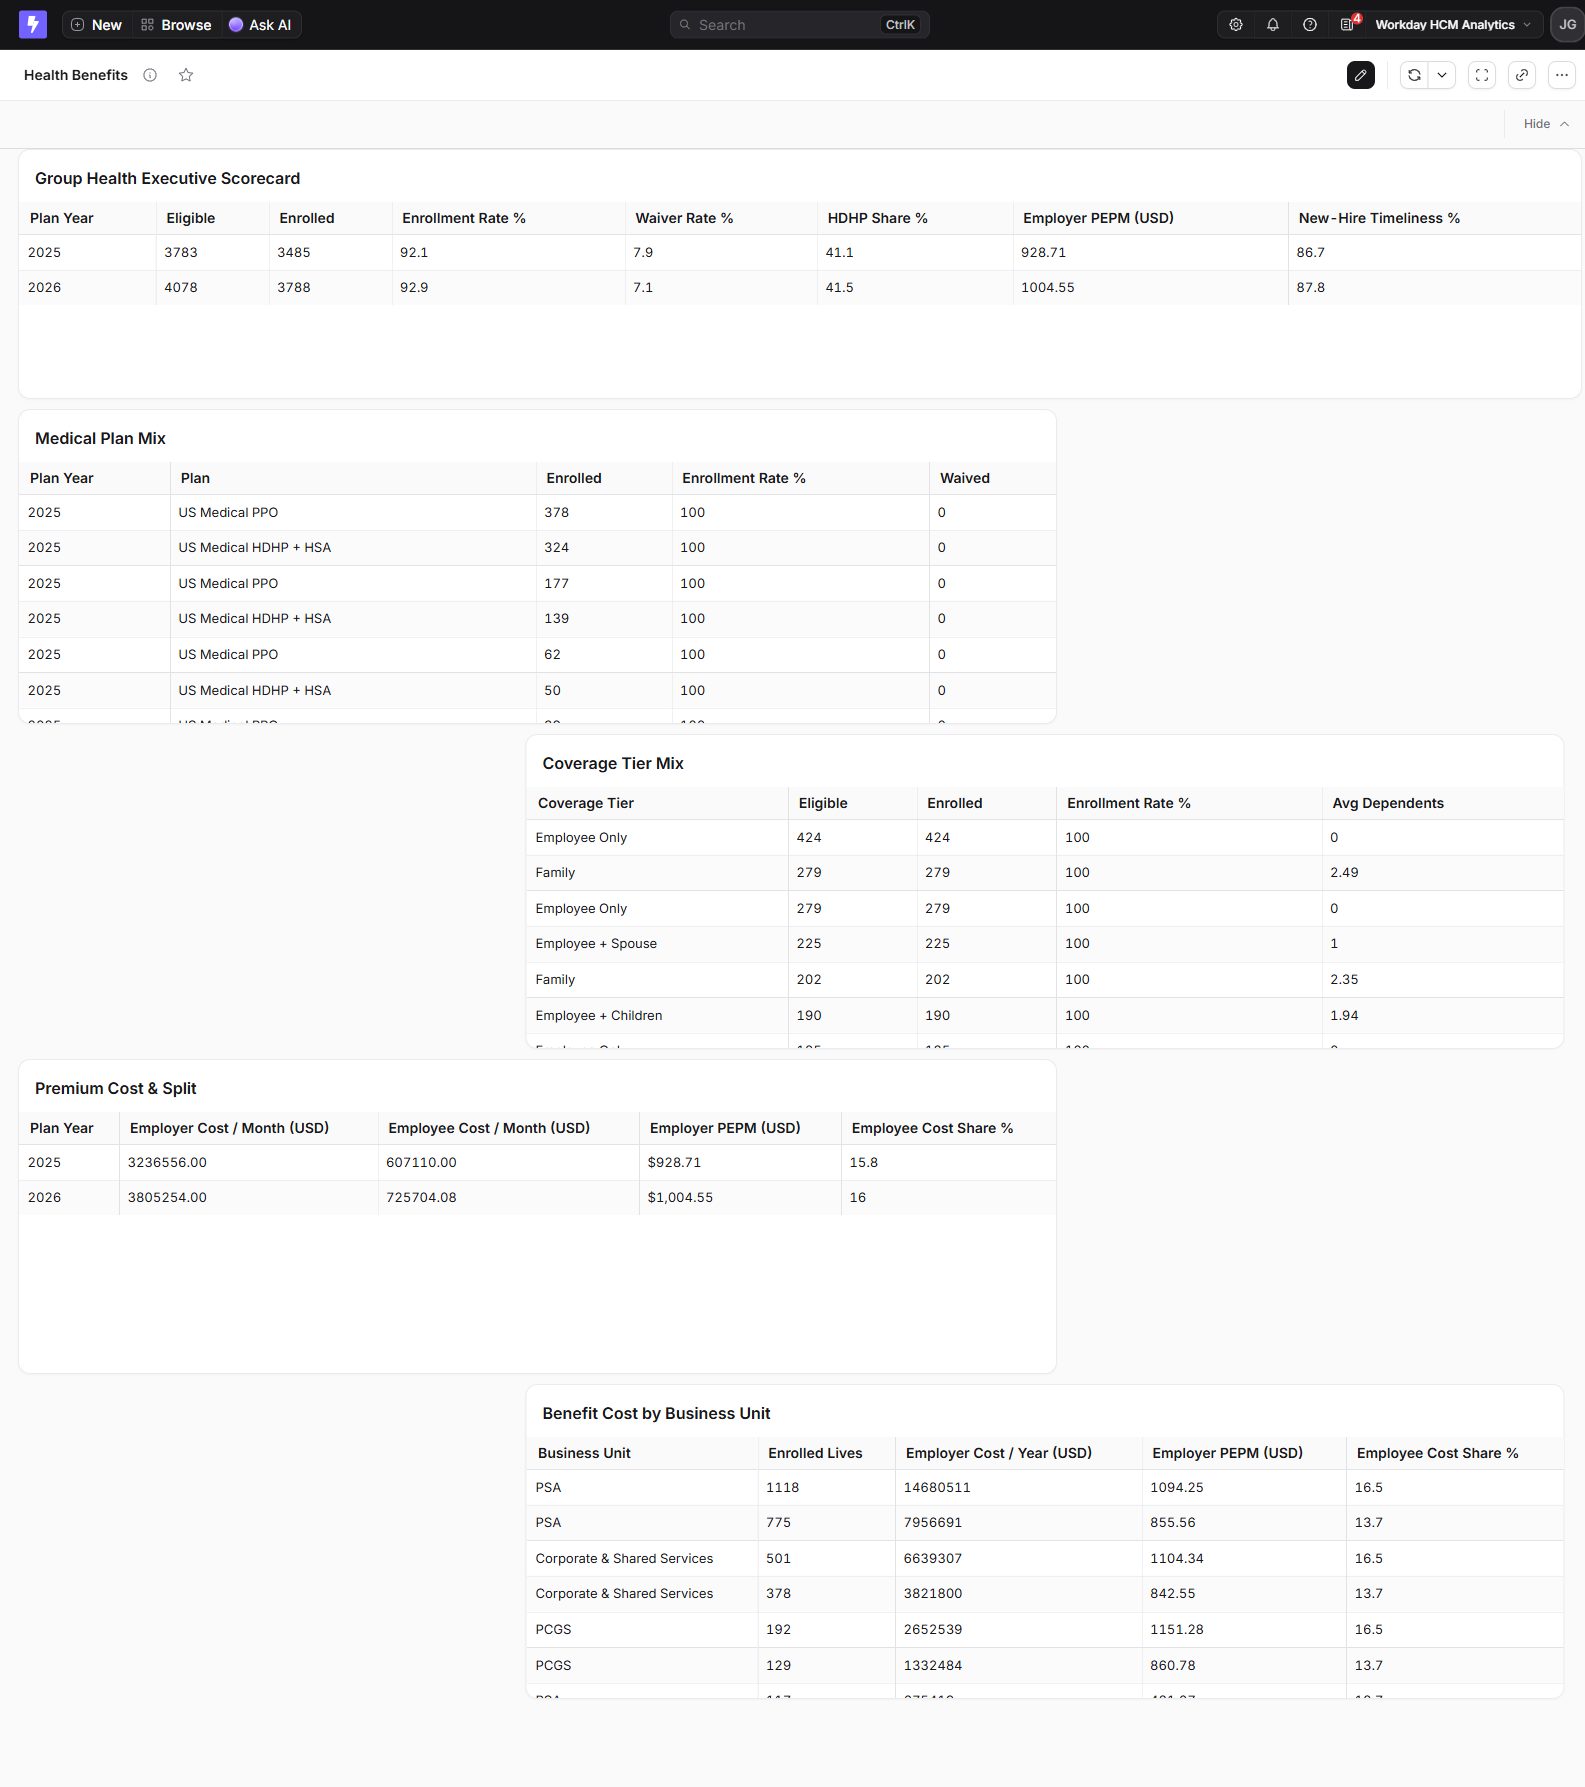
Participation, plan mix, enrollment, coverage tiers, and benefit costs.
View live dashboard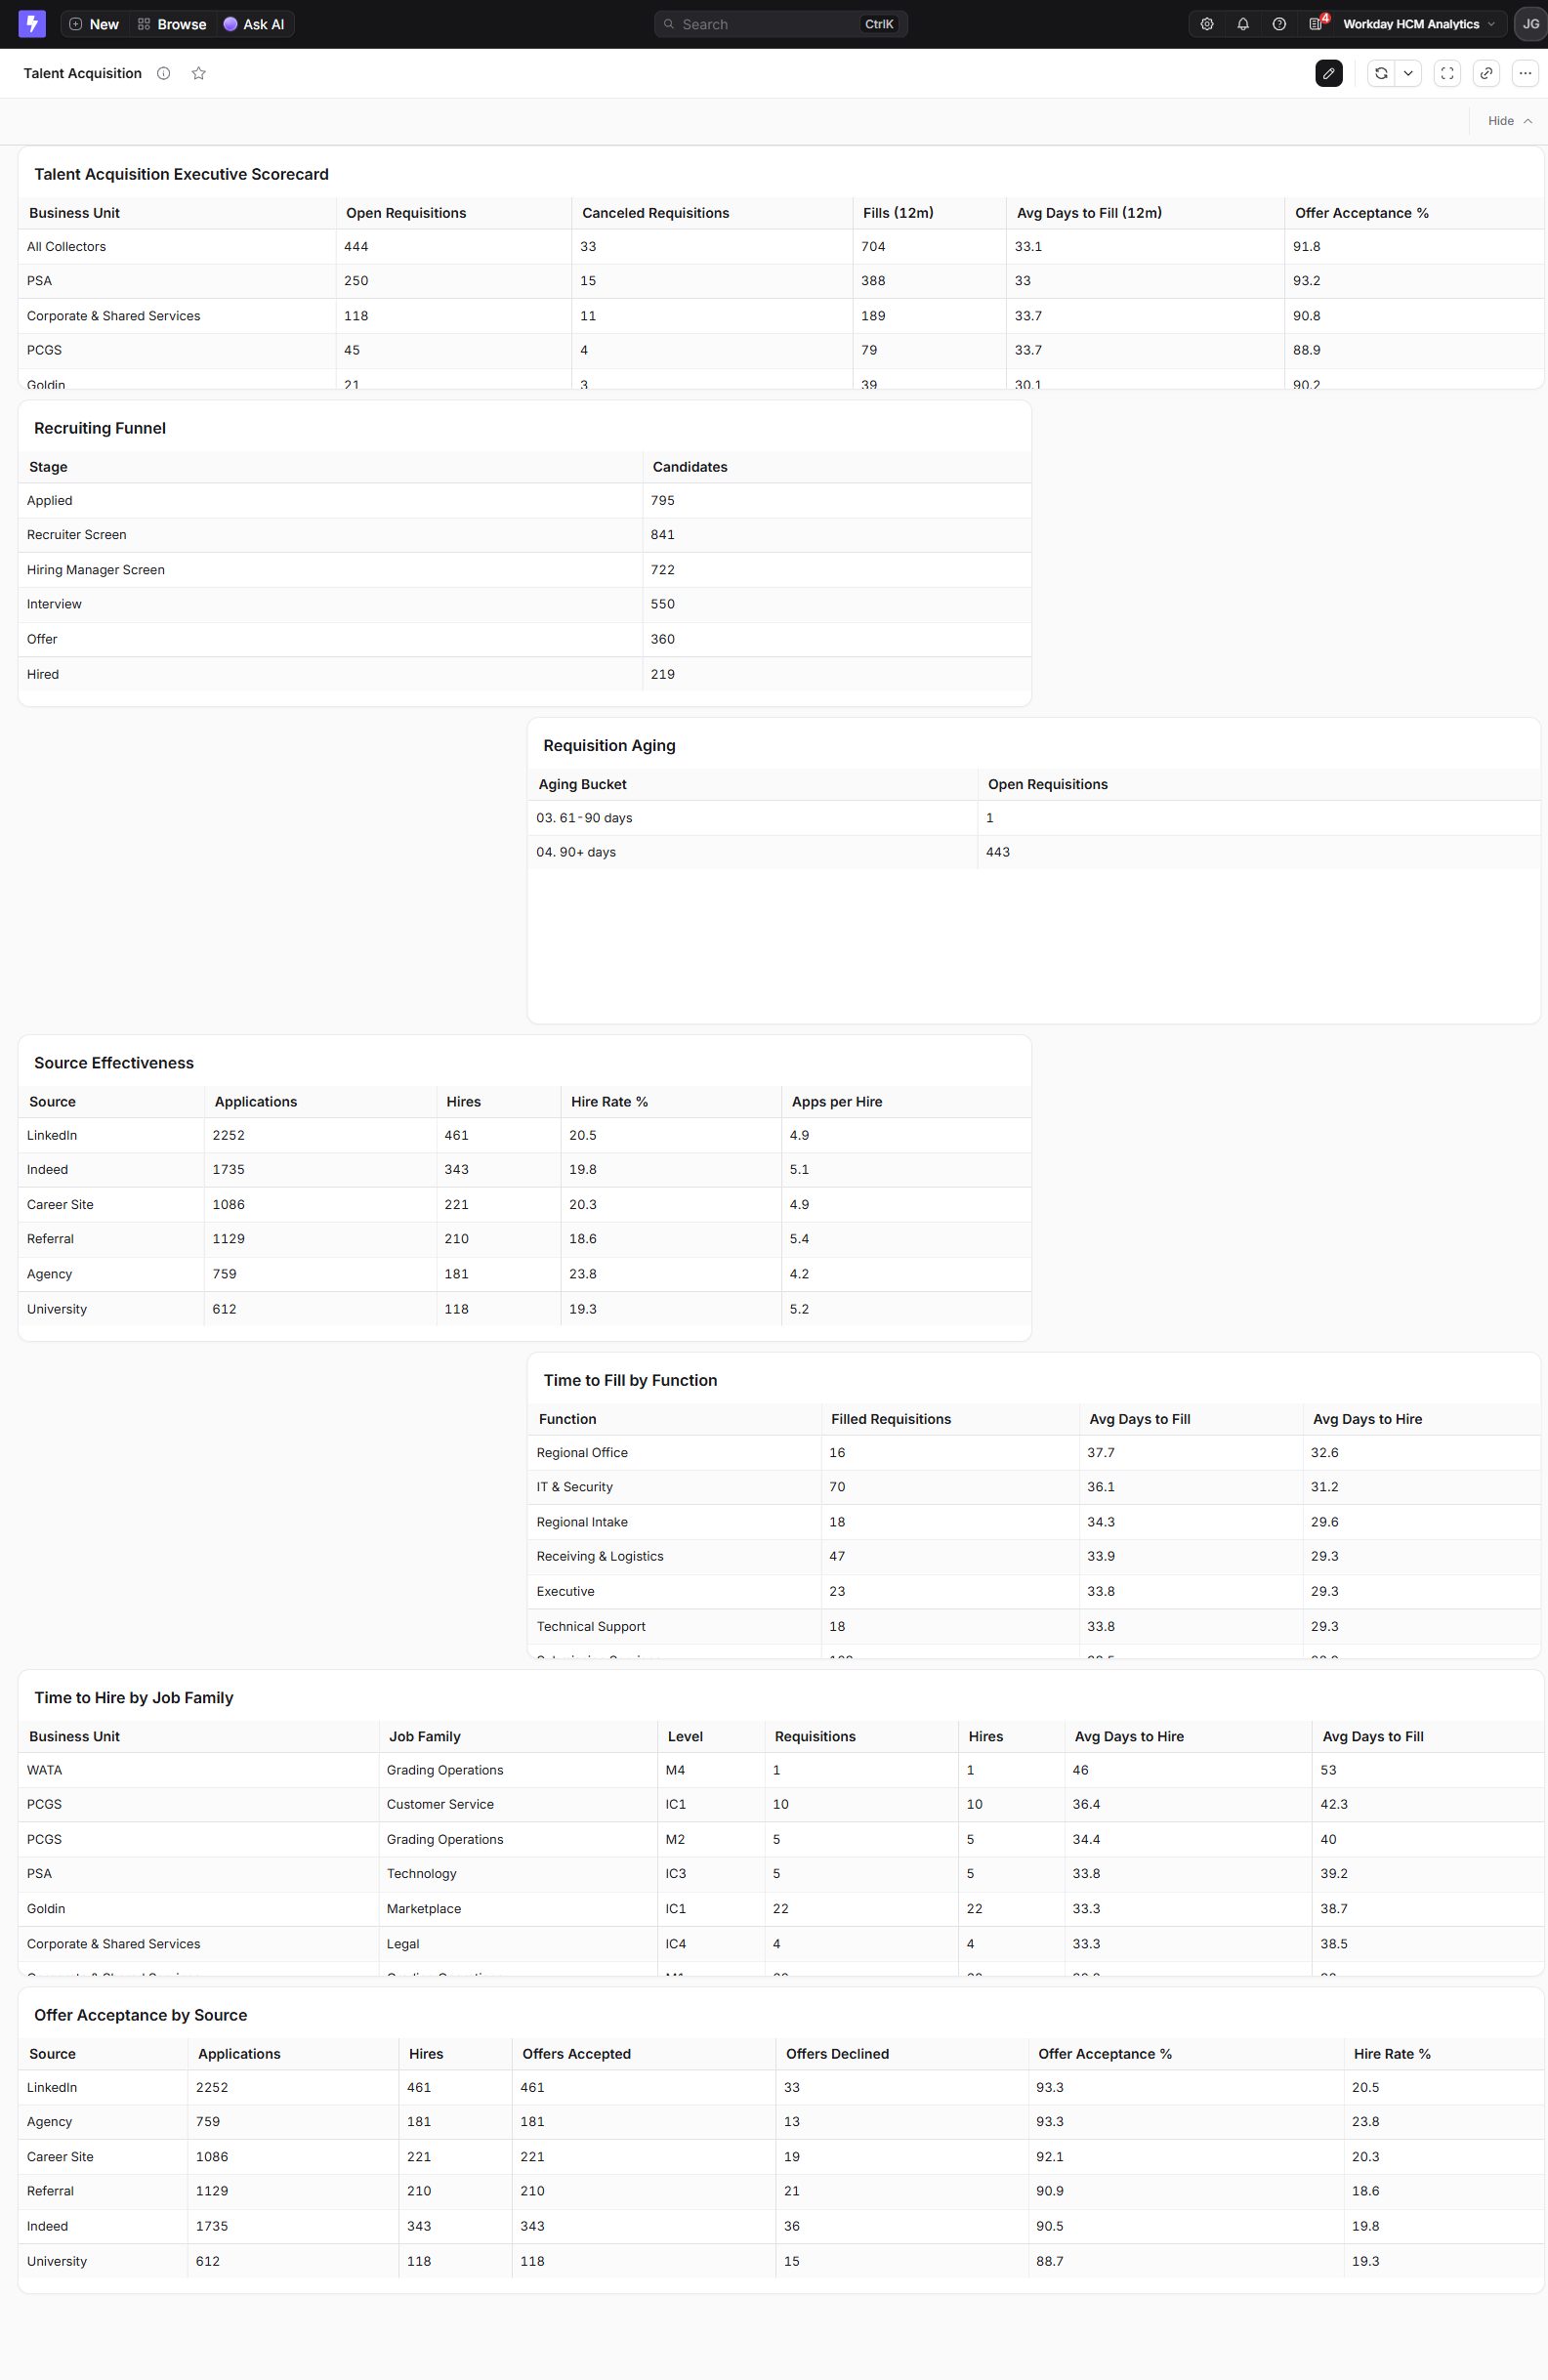
Recruiting backlog, funnel throughput, aging, source effectiveness, and speed.
View live dashboard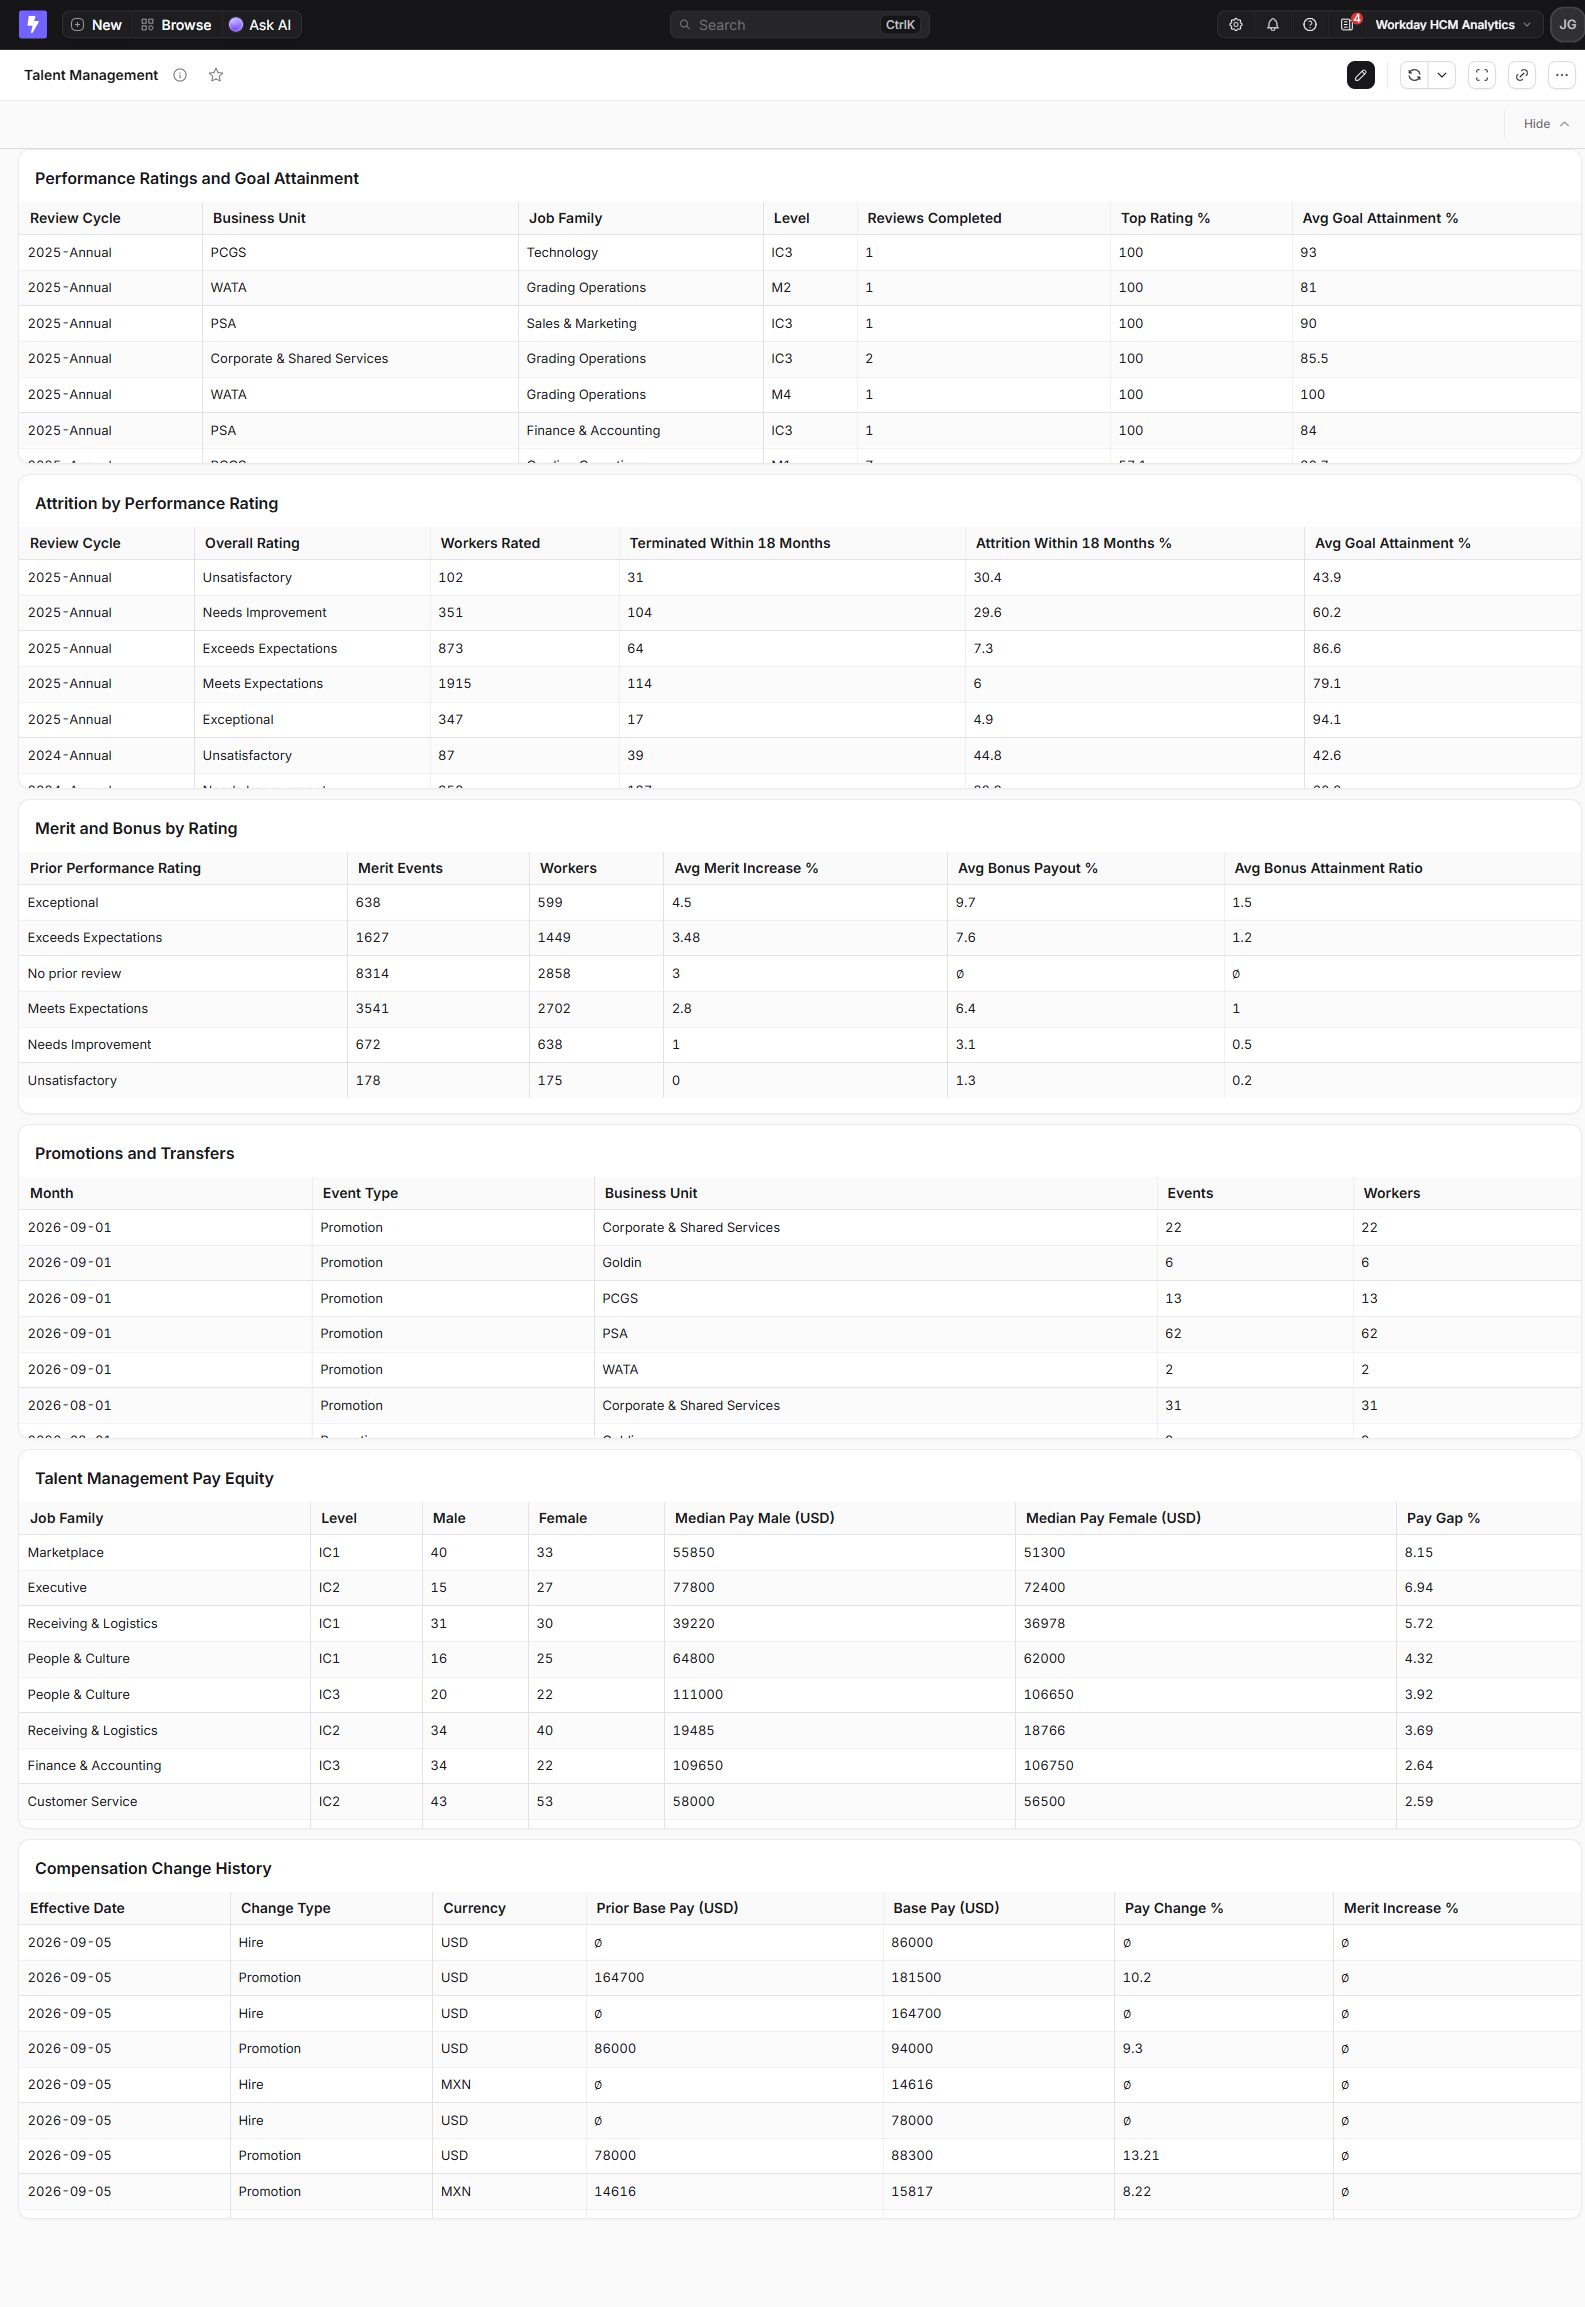
Performance, goal attainment, mobility, compensation, and pay equity.
View live dashboard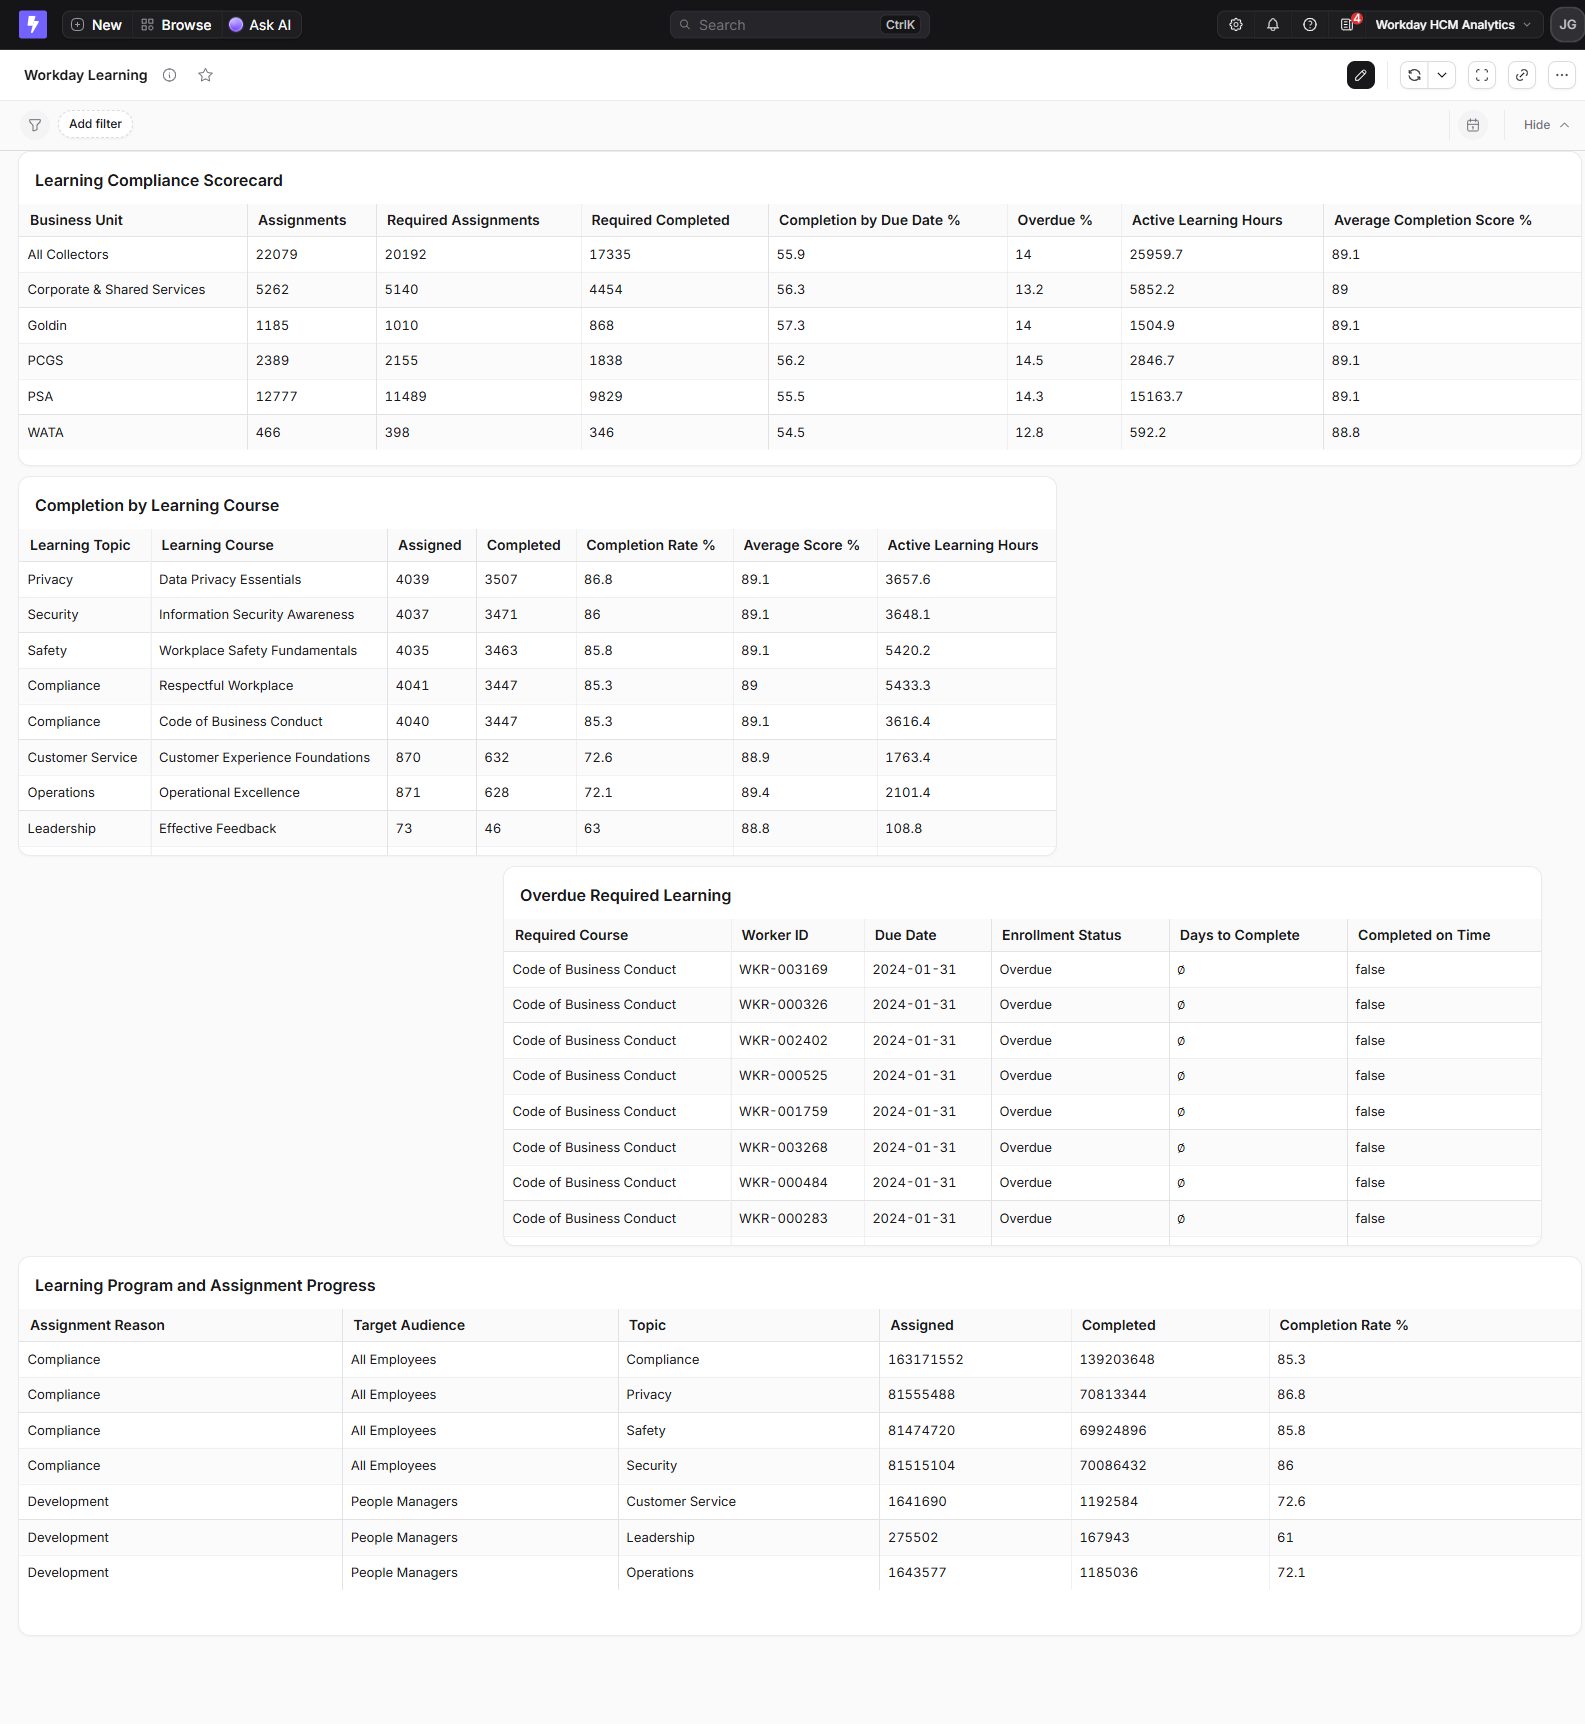
Required learning completion, overdue assignments, progress, and scores.
View live dashboard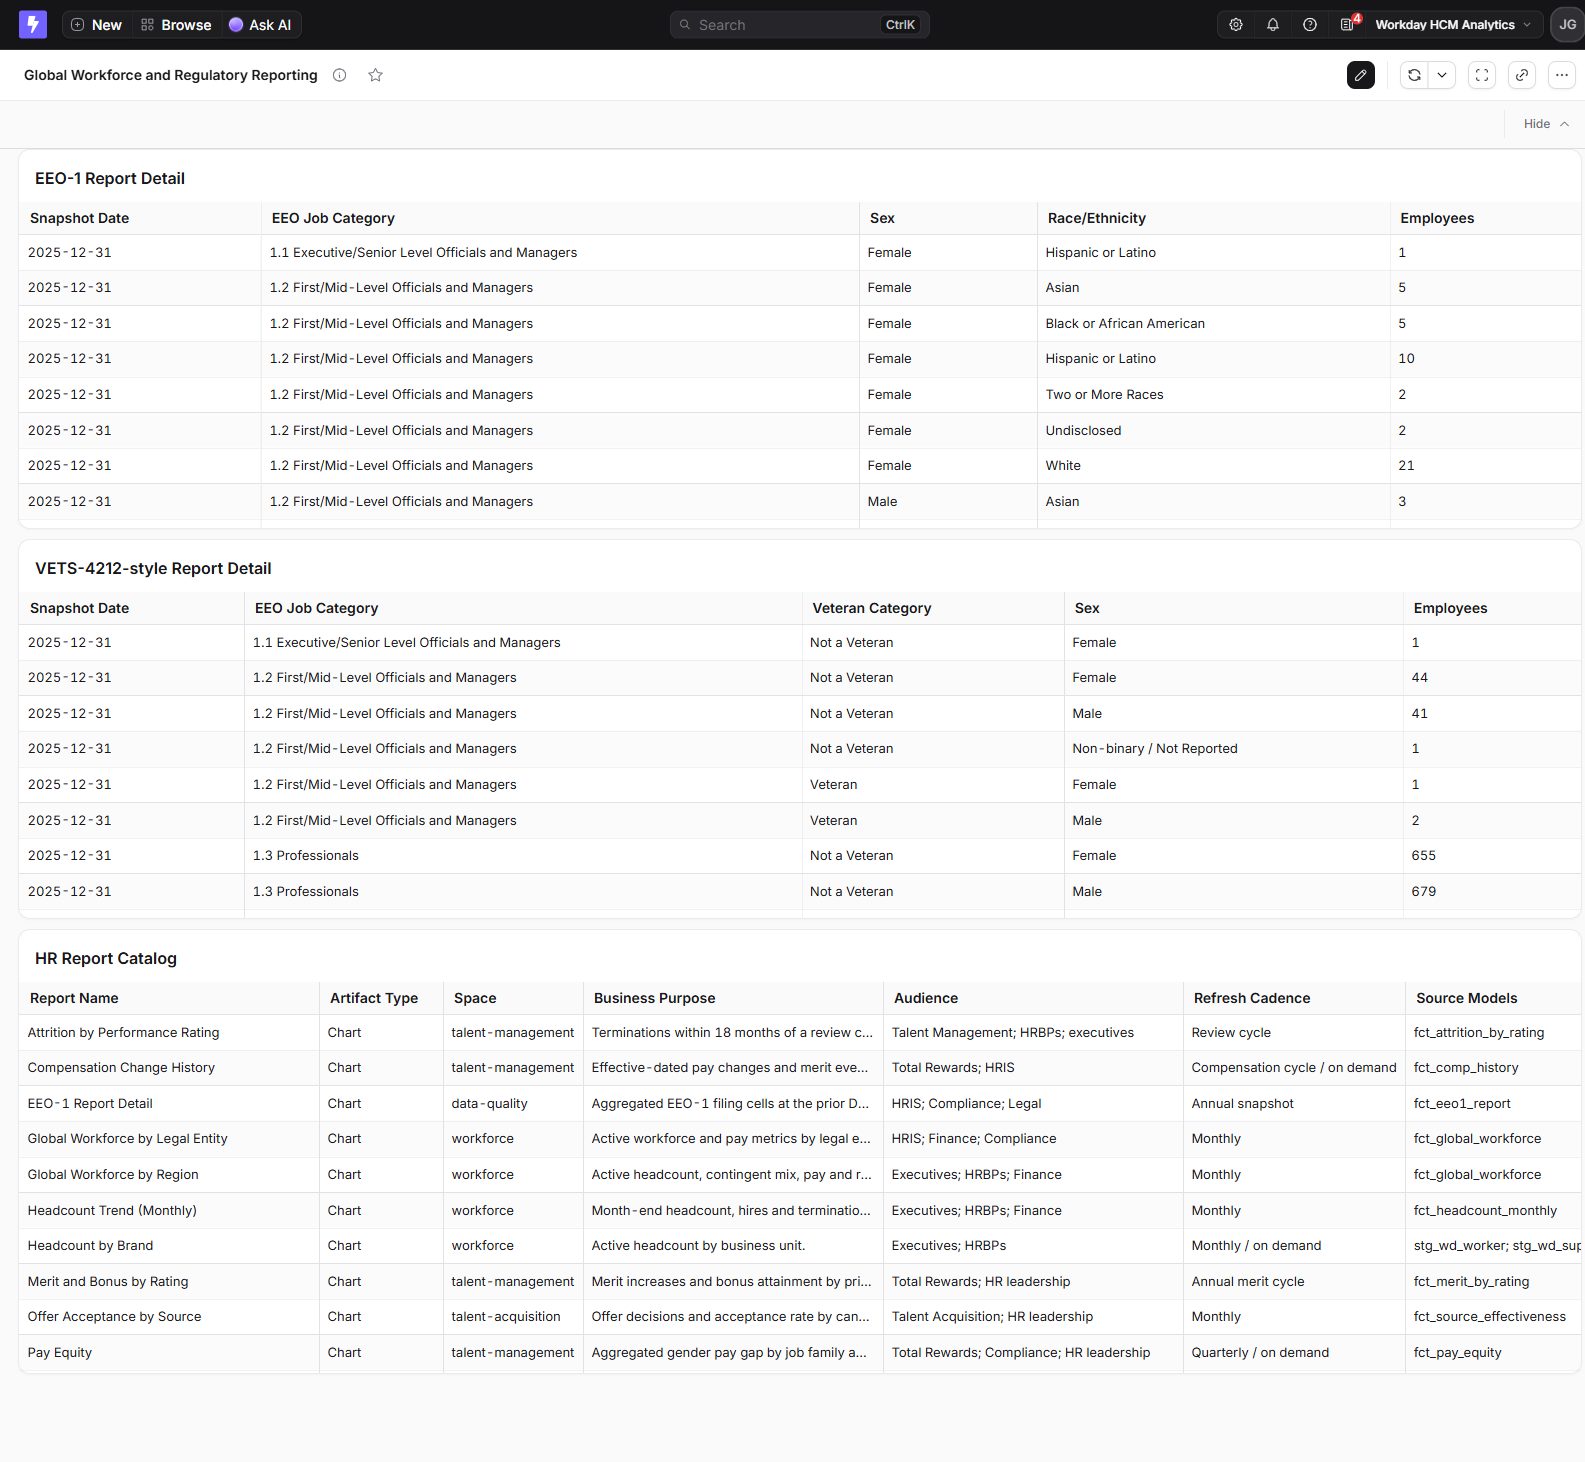
Global workforce context and EEO-1-style and VETS-4212-style reporting.
View live dashboard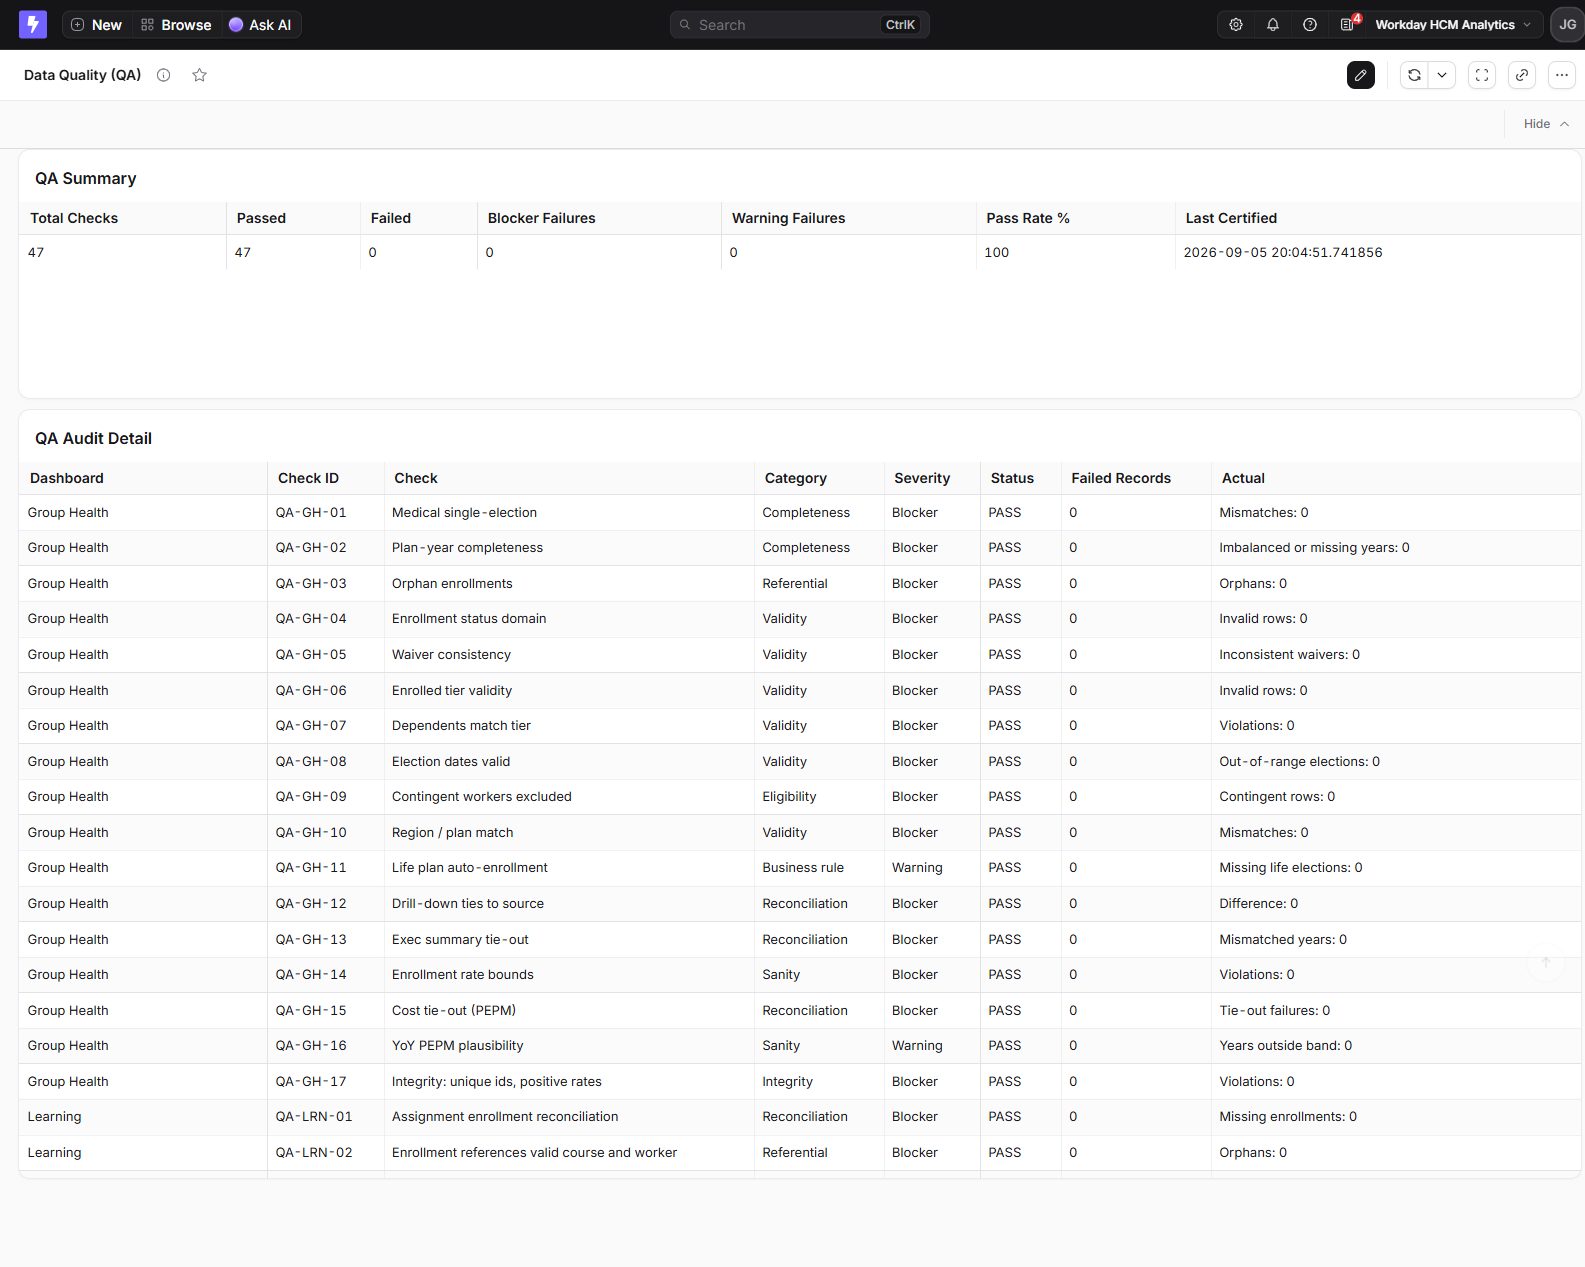
Release readiness, QA summary, audit detail, ownership, and blocker status.
View live dashboard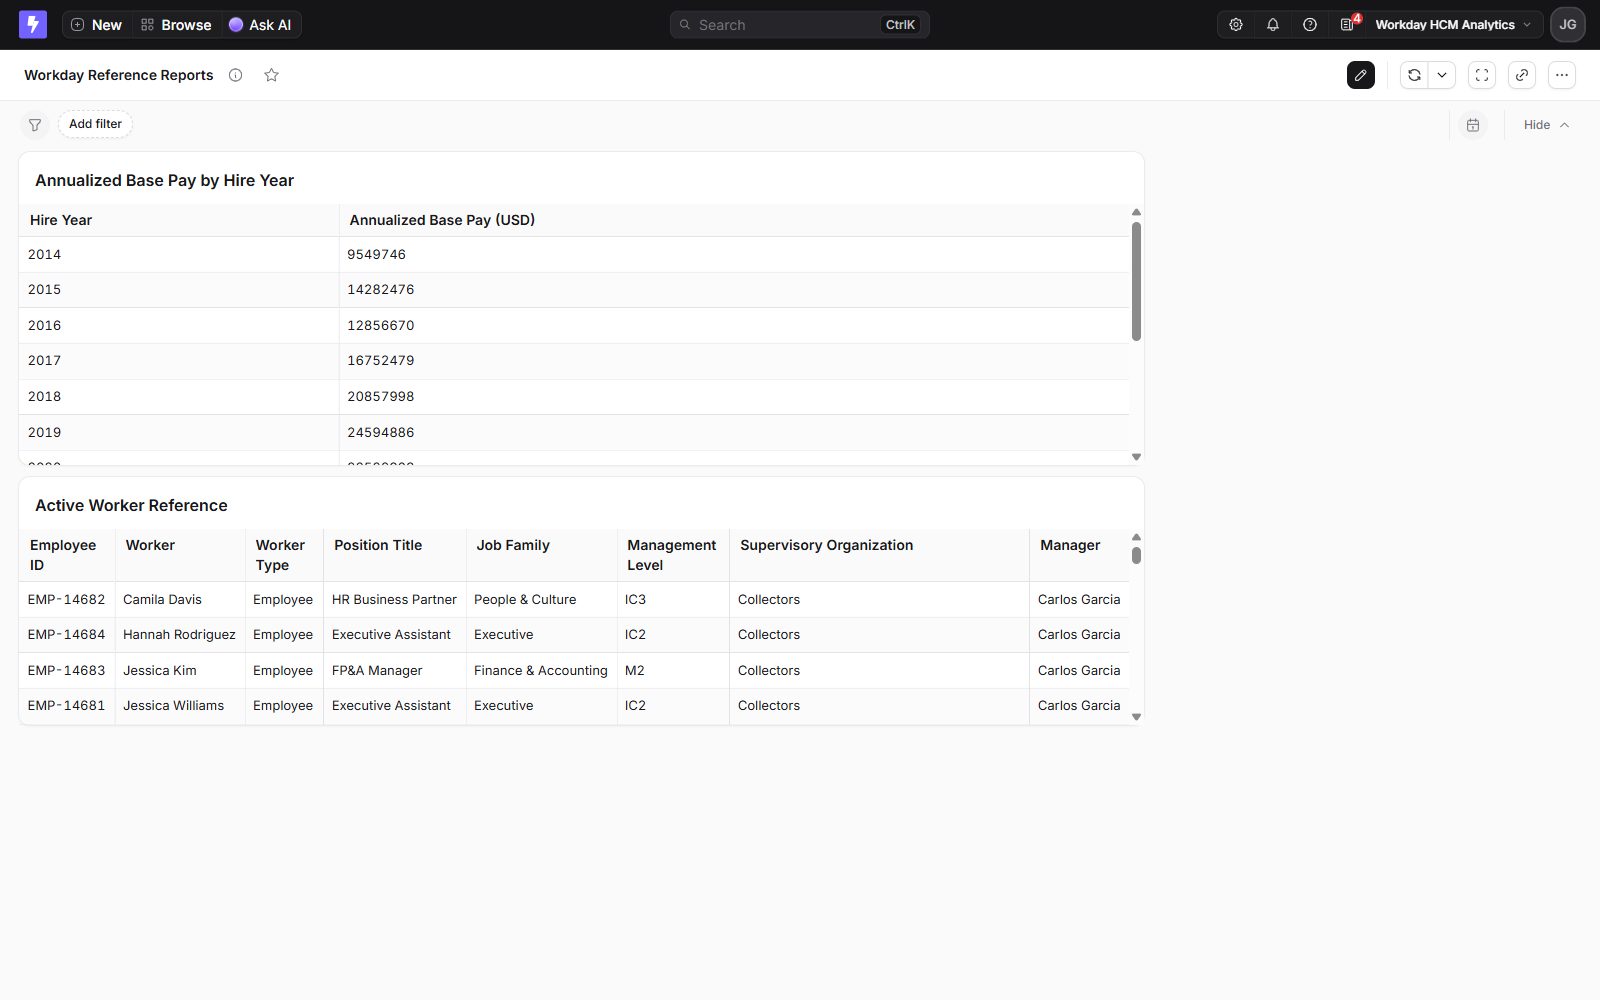
Governed report catalog and reference views across core Workday objects.
View live dashboardRaaS-inspired CSVs use display headers such as Worker ID and Learning Enrollment Status.
seeds/wd_*.csvQuoted source headers are cast, standardized, null-handled, and exposed as stable snake_case fields.
models/staging/stg_wd_*.sqlJoins, denominators, effective dates, cohort logic, and business rules are implemented once.
models/marts/fct_*.sql
models/marts/rpt_*.sqlCharts are intentionally thin: select published fields, apply presentation filters, and order results.
lightdash/charts/*.sql.ymlGovernance principle: A metric is not trusted merely because the SQL runs. It is trusted when the grain, denominator, population rules, reconciliation checks, and ownership are documented.
| Field | What to explain |
|---|---|
| Business purpose | The decision or operational question the chart supports. |
| Grain | What one output row represents: a business unit, worker, course, requisition, month, or reporting cell. |
| Source mart | The governed dbt model that owns the business logic. |
| Filters | Population rules, date windows, minimum cell sizes, or status restrictions. |
| Metric definition | Numerator, denominator, date logic, exclusions, and rounding. |
| QA control | The test or reconciliation proving the result is complete and valid. |
| Metric | Definition | Governance note |
|---|---|---|
| Headcount | Workers active at a point-in-time snapshot: hire date is on/before the snapshot and termination is null or after it. | Always state the snapshot date and whether contingent workers are included. |
| 12-month attrition | Trailing terminations divided by the current headcount in this demonstration. | This is a planning rate, not a formal annualized average-headcount turnover rate. |
| Enrollment rate | Enrolled elections divided by eligible elections. | Benefits eligibility must reconcile to enrolled plus waived. |
| Completion by due date | Required Learning enrollments completed on or before due date divided by required assignments. | Do not confuse completed eventually with compliant completion. |
| Overdue rate | Required assignments with overdue status divided by required assignments. | Document whether future-due incomplete assignments are excluded. |
| Pay gap | Male median pay minus female median pay, divided by male median pay. | This is an aggregate screening metric, not a controlled pay-equity analysis. |
| Time to fill | Days from requisition creation to filled date. | It measures requisition lifecycle; it is different from candidate time to hire. |
| Span of control | Direct reports assigned to a manager. | The 3–12 band is a screening heuristic, not a universal target. |